Although it is known to contain inaccuracies, Kent et al. (1993) used the List of Selected Ships (WMO, 1990) to estimate that, at about that time, 70% of the global VOS fleet provided visual estimates, 22% used fixed anemometers, and 8% used hand-held anemometers. Which method was used depended principally on which country’s meteorological agency had recruited the VOS, for example Germany and the UK advocate visual estimates whereas Japan and the USA use fixed anemometers and France supplies hand-held anemometers. Thus, although many VOS operate world-wide, the mix of wind observation methods can be expected to vary from one ocean area to another. This is confirmed in the maps of the percentage of anemometer wind reports in the UK Meteorological Office marine data bank, presented by Ive (1987) for each 5 year period from 1960 to 1979; typical values are shown in Figure 1. Cardone et al. (1990) also give the numbers of measured and visual observations for 3 areas, values estimated from their graphs are also shown in Fig. 1 together with values from (Ramage, 1987) which, although attributed to the global VOS fleet, are presumed to relate to the South China Sea.
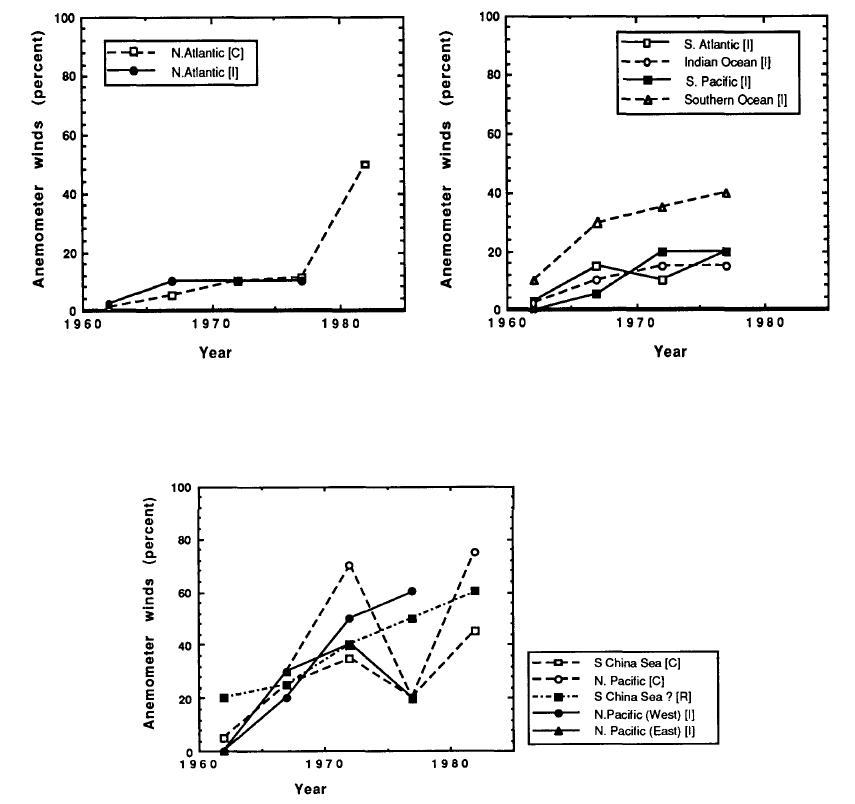
Several features are apparent from Figure 1. The number of anemometer derived winds has increased more rapidly in the Pacific compared to other ocean areas. Most of the winds from the Atlantic are visual. In the Southern Ocean there are a significant number of anemometer reports, probably from research ships and Antarctic supply vessels. There are problems with the data. Ive (1987) notes that all USA VOS reports for 1975 to 1981 were flagged as visual and this error also appears to be evident in the data of Cardone et al. (1990) for the North Pacific and South China Sea. The rapid increase in numbers of anemometer winds from the North Atlantic shown by the latter authors also looks suspicious compared to the previous trends.
Figure 1 clearly shows that, unless visual and anemometer winds can be shown to be equivalent, there is the potential for introducing spurious spatial and temporal variations in the calculated wind climate.